What are Core Web Vitals and how to measure them?
Core Web Vitals are metrics related to page load speed, responsiveness, and visual stability. Learn about them and how to measure them.

Intro to Core Web Vitals
Long gone are the days when stuffing your content with keywords or acquiring links from external sources was enough to rank your web page high on Google and other search engines. In the past several years, search engines have become much smarter, and tricking them with simple techniques is not enough. And that’s excellent news! Now, engines like Google are looking into user experience and overall experience you have with the webpage as a ranking factor. Core Web Vitals is a step in that direction.
As Google claims, optimizing for UX quality is one of the crucial elements impacting the success of a website. And this is not exactly a new thing. In the past years, Google already included many features and ranking signals on your web pages.
Those existing experience metrics are mobile-friendliness, HTTPS support, safe browsing and adherence to general Webmaster guidelines, and intrusive interstitial guidelines.
They are now expanded with Core Web Vitals to give you a better and more comprehensive understanding of your page experience and how it is acting in a real-world environment.
Core Web Vitals?
Core Web Vitals are a set of metrics related to page load speed, responsiveness, and visual stability. Keep in mind that Core Web Vitals (CWV) are a subset of much broader Web Vitals metrics and elements, but CWVs apply to all websites, and as such, they will appear in different Google tools. We’ll cover Core Web Vitals metrics, and explain how to measure them a bit later in this post.
Google lists three critical elements of an excellent page performance concerning CWVs:
- Load speed performance
- Responsiveness
- Visual stability
All these facets reflect what real users and site owners experience in the real world and how they directly impact their experiences.
As Google said, these metrics will evolve, but for the time being, they are related to those three elements mentioned earlier. And each of those elements is tied to measurable metrics.

Largest Contentful Paint – LCP
LCP measures load times and loading performance. The general idea is to quantify perceived load speed – how quickly a web page is loading and rendering all of its visual elements and content for the user. Historically, there have been numerous attempts at trying their best to describe the user’s perception of page speed load.
In the past, older metrics were used to load or window.onload events. It translates to how useful the web page is.
Another approach was to use the DOMContentLoaded event. This event fires when an initial HTML document has been completely parsed and loaded, regardless of CSS, images… Because of that, the perceived and real content rendering speed was not exactly related.
More advanced metrics, like First Contentful Paint (FCP), were a reasonable effort, but they are focused on the start of the loading experience. For example, showing a loading indicator (spinners) would trigger the FCP, but just seeing the loading or splash screen is not useful for the end-users. Google then experimented with First Meaningful Paint (FMP), Speed Index (SI), and more… But as they said it themselves – sometimes the simpler is better, and in their discussions with the W3C Web Performance Working Group, LCP was born.
LCP reports the render time of the largest image or text block that is shown and visible to users within the viewport. This includes <img>, <image> within <svg>, <video>, block-level elements, and elements with background images loaded via the url(). Not the CSS gradient.
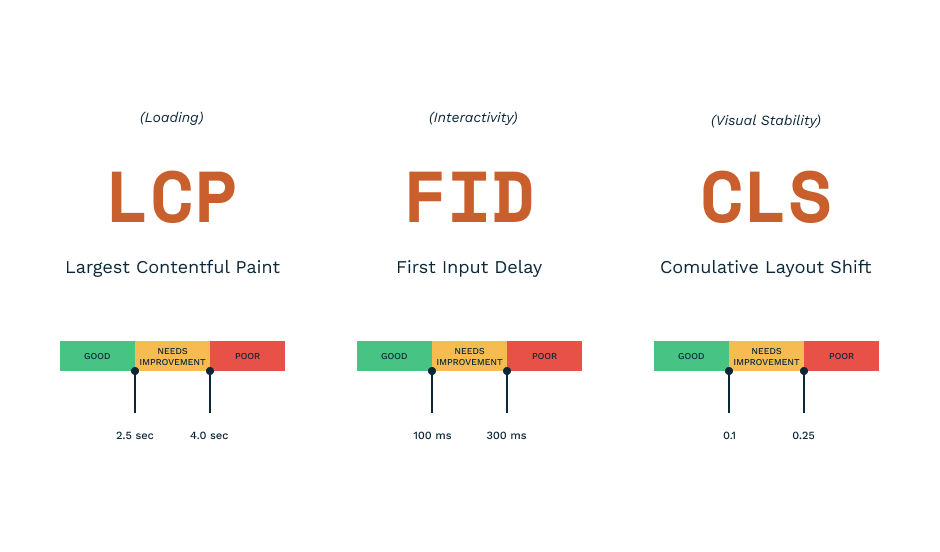
Web developers should aim for LCP, which is 2.5 seconds or less. Google also recommends using the 75th percentile of page loads, segmented across your mobile and desktop device visitors, as a reasonable threshold.
More on LCP can be found here.
First Input Delay – FID
FID measures interactivity. Much like LCP, it is also an essential and user-centric metric, and it quantifies the experience users feel when they are attempting to interact with unresponsive pages. It translates to the overall perception of how usable is your web page.
FID aims to quantify the time between the user’s first interaction on the web (clicking a link, tapping a button…) to when your web browser can begin processing such an event.
It is also related to something that is commonly known as input latency, and longer latency times happen when the main thread of the web browser is busy with performing other operations so it can’t react to the user’s input. There are many reasons – it is often related to parsing and dealing with complex JavaScript files loaded by your website or your app.
There are several good reasons why FID deals with the first input only. The number one reason is that the first input delay will likely be the one first experienced by a user on your website, and if that first impression is bad, it will likely shape the general perception of the website. In addition to this, the most significant interactivity issues typically occur during the page loading – thus – focusing on those first interactions will likely have the most substantial effect.
Web developers should aim for an FID of 100 milliseconds or less. And while the general threshold for CWVs is 75th percentile, in the case of FID, you should use 95-99th percentile for both desktop and mobile users since this will show the areas where the greatest improvement is required.
You can learn more about the FID here.
Cumulative Layout Shift – CLS
CLS measures the visual stability of the web page. Again, it is a user-centered metric dealing with visual stability. As such, it is trying to quantify how often unexpected content and layout shifts happen. By keeping those CLSs low, you are communicating how delightful your web page is.
We’ve all encountered those frustrating layout shifts. Text jumping around, buttons changing their positions – it is incredibly frustrating, and as Google’s screencast video below shows – it can have severe consequences like unintended orders.
What causes those unexpected layout movements? There are several key sources of this behavior. Sometimes the resources are loaded asynchronously. While there are good reasons to do that, sometimes, it can lead to undesired consequences.
Another situation is adding elements to a DOM dynamically, above the content you are currently looking at. Other options include changes in font sizes (fallback font has larger or smaller dimensions than the original font) or adding videos or images of unknown dimensions, and more…
LCS measures how often those shifts happen and helps you improve your web pages. In more strict terms, CLS sums the total of all individual layout shifts for every unexpected layout shift happening during the entire page lifespan. The web browser will look at the viewport size and check the movement of all unstable elements.
Developers should aim for a CLS of 0.1 or less. Again, you should aim for the 75th percentile of your desktop and mobile users and fix these issues.
To learn more about CLS, go here.
How to measure Core Web Vitals?
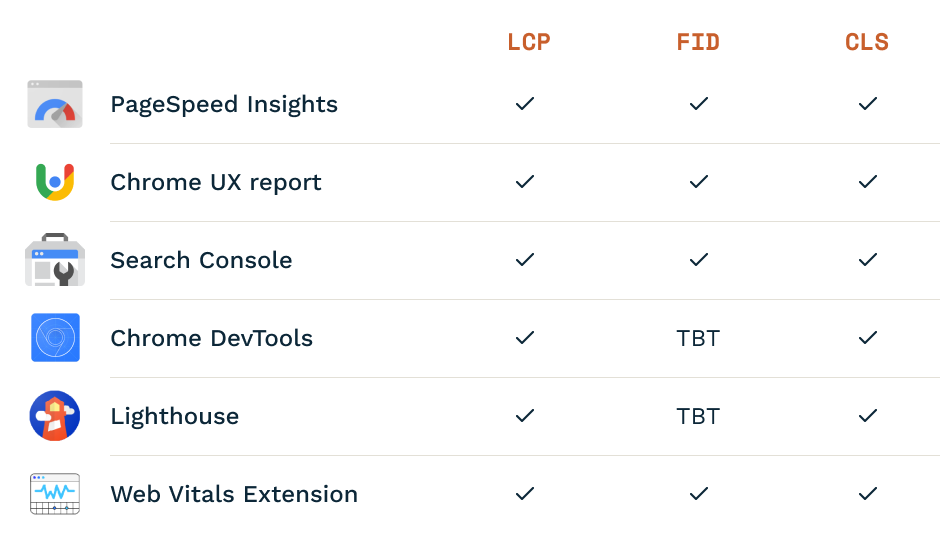
Evaluating and measuring Core Web Vitals is crucial. If you can’t measure it – you can’t fix it. Right now, Google provides at least six places where you can access and measure CWVs. And they said that those metrics would surface on all web dev/web-related tools they are offering.

All their CWVs – KCP, FID, and CLS – are available with PageSpeed Insights, Chrome User Experience Report, Search Console (as a part of Search Console Core Web Vitals Report), and Web Vitals Extension. Chrome DevTools and Lighthouse still don’t support FID – instead, they are using TBT (Total Blocking Time), but this will change.
Effect of Core Web Vitals on the SEO
Google is transparent in its intentions that Core Web Vitals will be one of the signals affecting the web page ranking on its search engine. In addition to existing signals and indicators, CWVs will be used to assess better real-life user experiences – usefulness, usability, and delightfulness.
CWVs became ranking factors and signals in June of 2021, and Google provided a solid 6-month notice before they rolled out.
If you still haven’t checked them, you shouldn’t wait. Head out to try some of the available tools and assess your current standings and make a plan on how to fix those possible challenges. With enough time ahead, we can make improvements to our websites and ensure a useful, usable, and delightful user experience for all our website visitors. Plus, better SEO and rankings will be your reward.
Let’s connect
If you are looking to join a great team, head on to our Careers page, and apply. We will help you grow your development and engineering skills as well as your soft skills.
If you are a potential client, interested in hiring us, we should talk! We’d love to hear from you and learn how we can contribute to your success. Check out our work and cases and learn more about the services Point Jupiter offers.